
Brands continue to overwhelmingly focus their advertising on Meta, but that dominant position does not necessarily correspond to greater investment efficiency. TikTok presents lower costs in a large part of the advertising funnel and stands out especially when the objective is to achieve reach, clicks or potential customers.
This is clear from Metricool’s “Social Ads 2026 Study”, prepared from 628,969 paid campaigns from 44,355 advertisers around the world, which represent a joint investment of 471.5 million dollars. The analysis compares the periods between January and June 2025 and 2026 and groups the results according to the different phases of the funnel and the monthly investment level of advertisers.
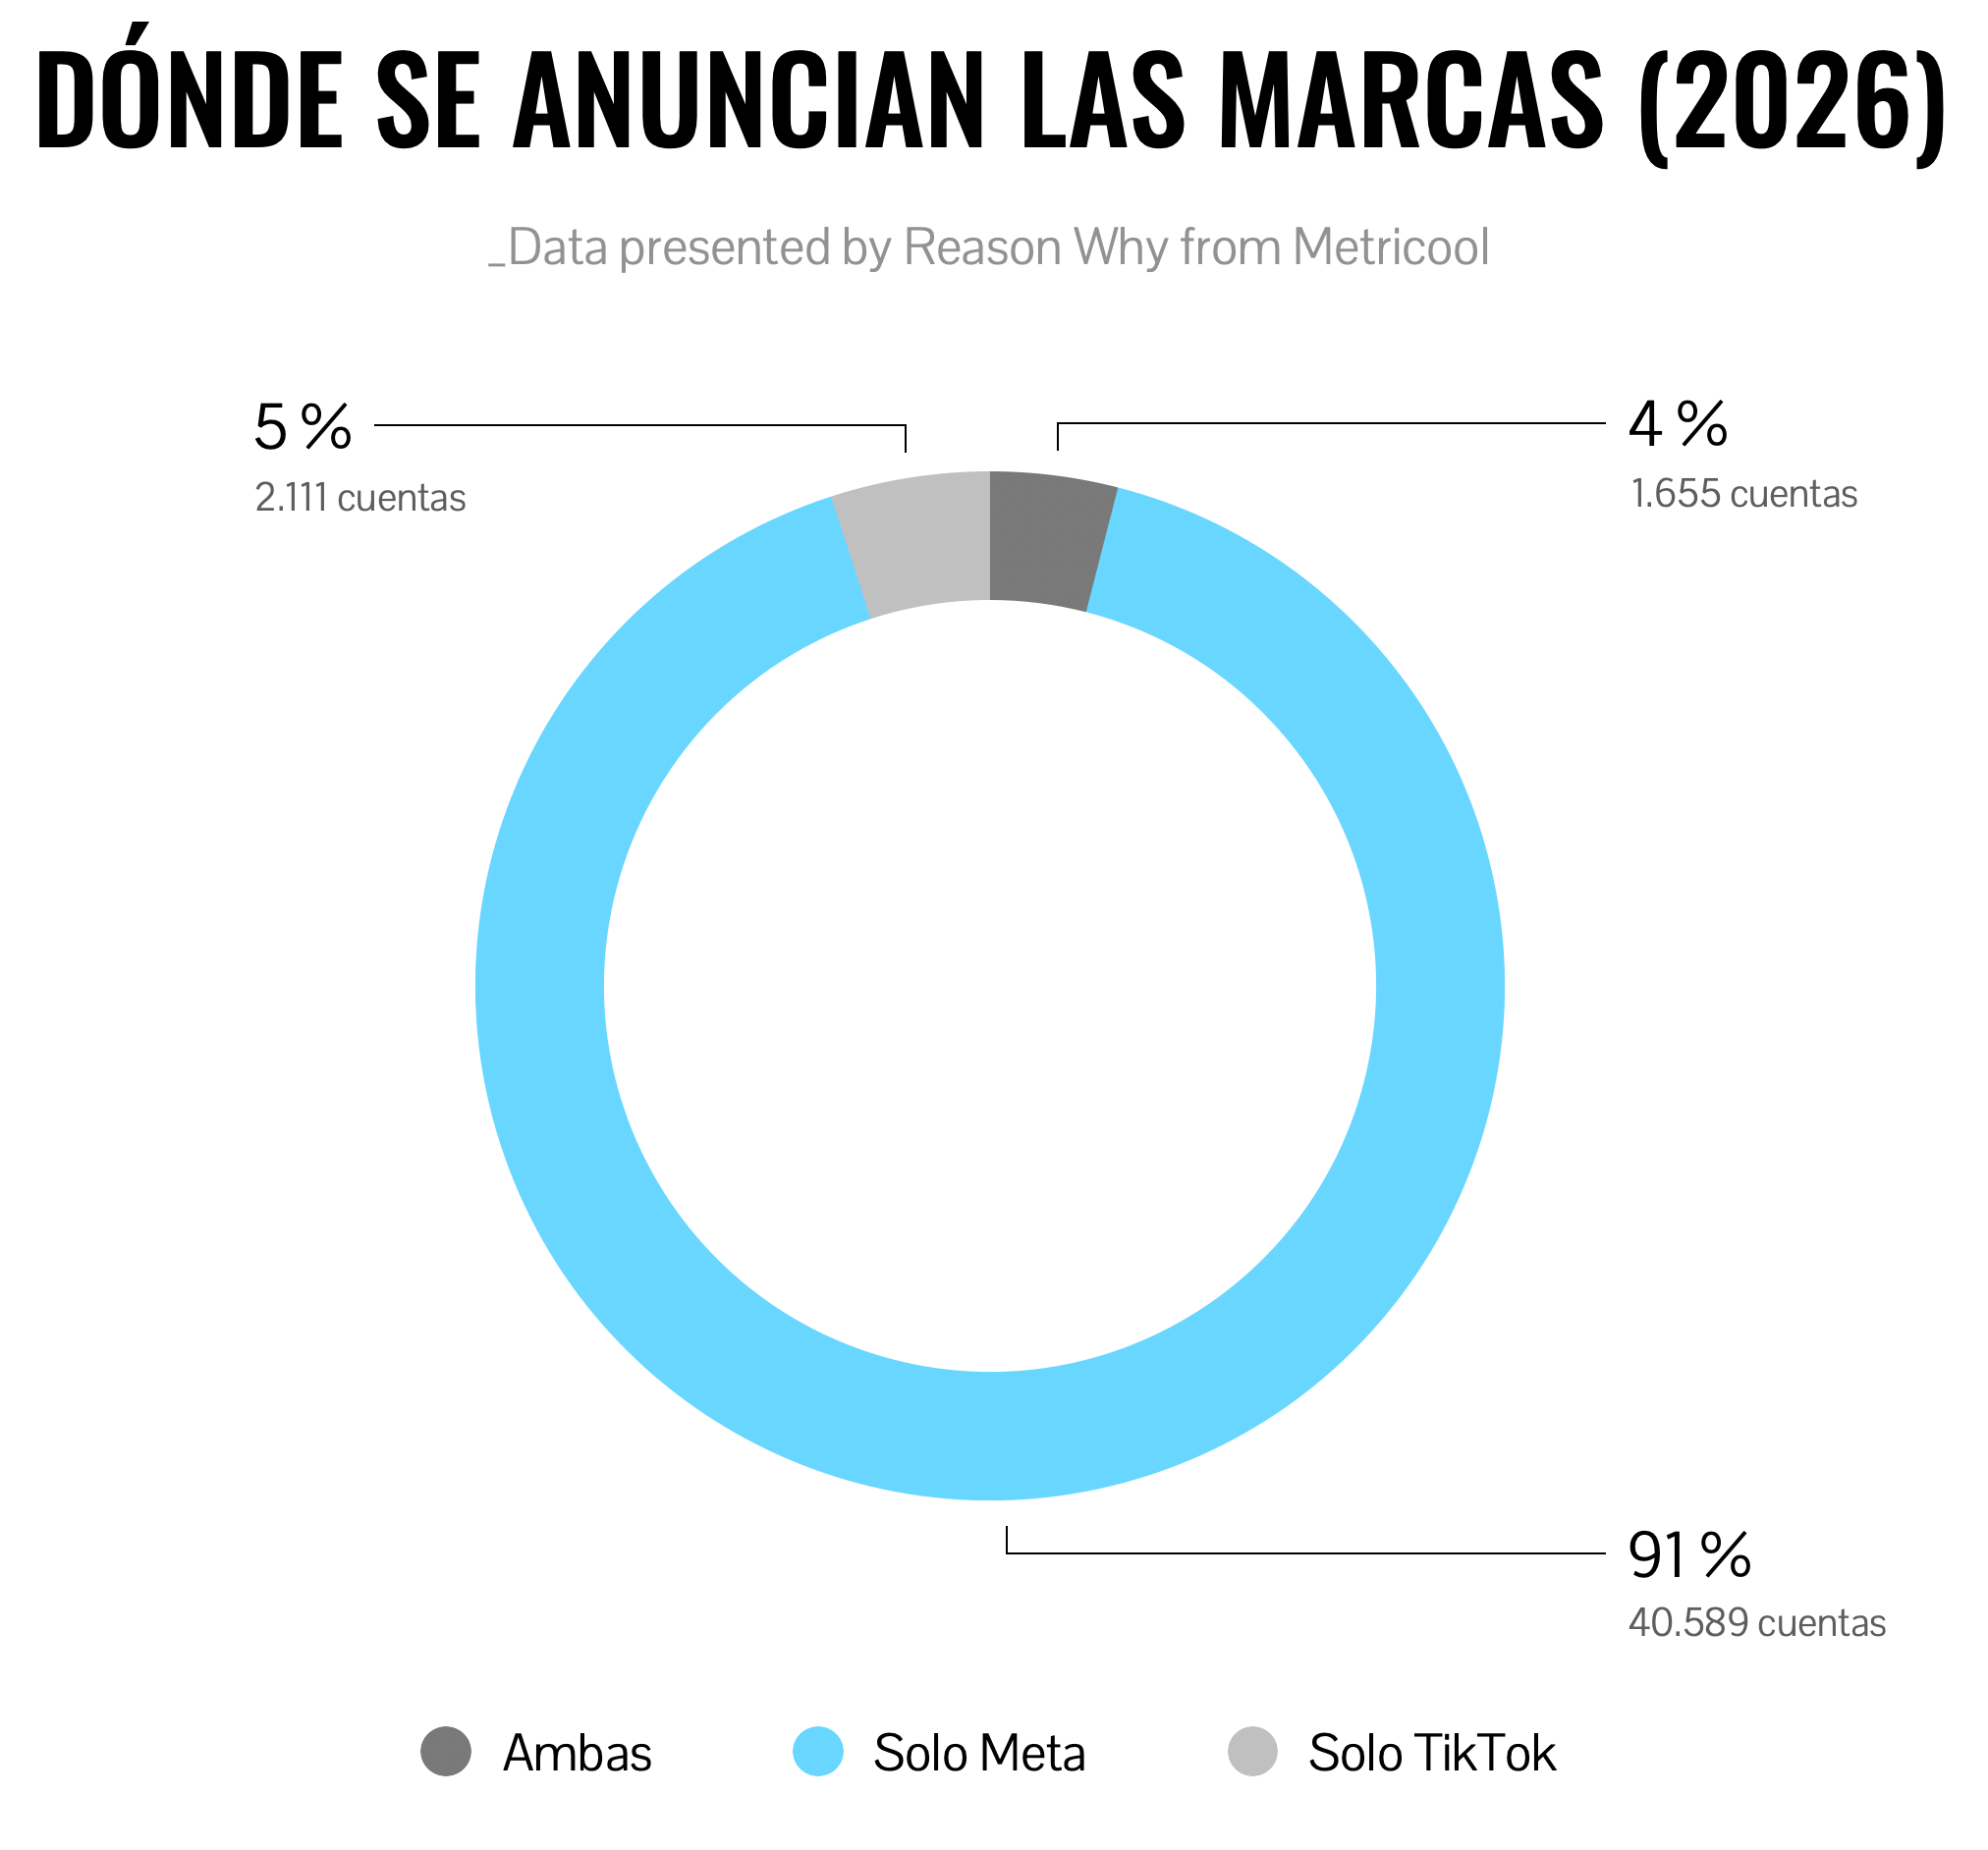
The general photograph shows a market that is still very unbalanced. 91% of the accounts analyzed advertise exclusively on Meta, compared to 5% that only use TikTok and 4% that work with both platforms. That is, only 8% of the advertisers in the sample use TikTok in some way.
However, when the analysis moves from adoption to performance, the distance between the two platforms changes considerably.
A click costs $0.03 on TikTok and $0.07 on Meta
The difference is especially clear in campaigns aimed at generating traffic. The cost per click (CPC) stands at $0.03 on TikTok and $0.07 on Meta. Put another way, the study estimates that brands pay 147% more for each Meta click.
Brands pay 147% more for each Meta click
The comparison makes more sense when looking at investment and results together. A traffic campaign on Meta records an average spend of $304.03 and generates about 4,594 clicks. On TikTok, the average budget amounts to $949.83, but it produces about 35,493 clicks. This means almost eight times more clicks with just over three times the investment.
The difference also appears at the top of the funnel. The CPM (cost per thousand impressions) reaches $0.48 on Meta compared to $0.38 on TikTok, 22% less. The campaigns analyzed on TikTok obtain on average more than 2.26 million impressions, compared to just over a million on Meta, although they also have a higher budget: $853.15 per campaign on TikTok compared to $493.65.
The cost has also increased on both platforms compared to 2025. The CPM grows by 8% on Meta and 5.5% on TikTok, while the CPC increases by 15% and 29%, respectively. TikTok thus maintains its price advantage despite the year-on-year increase.
The difference widens when the goal is to generate leads. On TikTok, the cost per lead has decreased by 33% compared to 2025, to $2.69. In Meta it has followed the opposite direction: it increases 14% and reaches 6 dollars.
The comparison is especially significant because the average spending of the campaigns is practically identical: $1,555 on Meta and $1,546 on TikTok. With that investment, Meta gets an average of 259 leads and TikTok, 574.
The report detects, however, interesting behavior on the path to conversion. Meta gets a 2% CTR, clearly higher than TikTok’s 0.75%, but a higher proportion of TikTok users end up completing the process. According to Metricool, the platform generates around six leads for every hundred clicks, compared to less than five on Meta.
Although there is one relevant exception to TikTok’s cost advantage: engagement. Meta obtains an engagement rate of 2.15%, compared to 1.99% for TikTok, and achieves 10.8 interactions for every dollar invested, compared to 8.2. It is the analyzed phase in which Meta maintains a clear advantage in efficiency.
Meta dominates investment, although TikTok gains ground
Despite these results, Meta continues to function as the default advertising platform for a vast majority of the advertisers analyzed. The distribution graph included in the study clearly reflects the difference: 40,589 accounts use only Meta, 2,111 exclusively TikTok and 1,655 both platforms.
Diversification also increases with the size of the advertiser. Only 0.78% of Tiny accounts – those that invest less than $100 per month – use both platforms, while the proportion reaches 20% among Huge accounts, which exceed $10,000 per month.
Now, among those who already use the two platforms, a progressive shift of the budget towards TikTok can be seen. In 2025, Meta concentrated 76% of this joint investment and TikTok 24%. A year later, the distribution increases to 74% for Meta and 26% for TikTok. And the movement is especially intense among smaller advertisers. In the Tiny accounts present on both platforms, TikTok already receives 44% of the budget, compared to 56% allocated to Meta. It is the most balanced distribution of all the segments analyzed.
More investment in Goal, but lower return
One of the most relevant results of the study appears when analyzing the evolution of advertising return. The ROAS of Meta’s sales campaigns falls from 5.48 in 2025 to 4.57 in 2026. That is, each dollar invested generated $5.48 in sales last year and now produces $4.57.
The fall occurs at the same time as investment grows considerably. The total spending analyzed in these campaigns has increased from 63 to 152 million dollars, while the value of attributed purchases increases from 345 to 694 million. Revenues are growing, but they are doing so at a slower rate than the budget.
“More budget does not automatically mean more efficiency”
The evolution of average spending per campaign reinforces that reading. In Meta it has increased 47%, from 489.53 to 718.45 dollars. On TikTok, where the average budget was already higher, the growth has been just 4%, from $1,262.10 to $1,308.97.
Metricool relates part of this difference to the increase in the price of Meta. The cost of reaching a thousand people has gone from $1.97 to $2.64, while on TikTok it has barely changed.
“More budget does not automatically mean more efficiency. That is one of the clearest conclusions from this year’s data”explains Juan Pablo Tejela, CEO and Co-Founder of Metricool. The manager points out that Meta continues to be the default option for most brands, but considers that TikTok is gaining competitiveness in specific objectives, especially reach, traffic and lead generation.
The accounts that spend the most are the ones that have the lowest ROAS
The investment volume also does not guarantee a proportionally higher return. Metricool divides advertisers into five groups based on their monthly spend: Tiny, Small, Medium, Big and Huge. ROAS falls in all five segments between 2025 and 2026.
The most striking result is found in the Huge accounts, those that allocate more than $10,000 per month to advertising. They are precisely those that register the lowest ROAS: 3.97, compared to 4.88 in 2025. Tiny accounts, despite managing the smallest budgets, reach an ROAS of 4.75.
The study also shows considerable differences by market. In Meta sales campaigns that reported purchase value, Spain records an average ROAS of 5.89, above the global average of 4.57. Norway reaches 12.12; Chile, 11.44; Argentina, 10,10; Mexico, 8.88; and Colombia, 8.37. At the opposite extreme are the United States, with 2.42, Germany, with 3, and Denmark, with 0.44.
Metricool warns, however, that this data must be interpreted taking into account measurement differences: the calculation is based only on Meta sales campaigns that reported purchase value, approximately 64% of the total, so in some markets the real return could be underrepresented.
The study also identifies a difference between the number of campaigns that brands activate and where they actually concentrate their money.
In Meta, 67% of the campaigns correspond to traffic or interaction, two objectives located in the middle of the funnel. However, 71% of the investment is directed at the end of the journey, mainly to potential clients and sales. The latter represent only 11% of the campaigns, but absorb 42% of the entire budget.
TikTok, for its part, presents a somewhat more balanced distribution. 33% of their campaigns correspond to the end of the funnel, where 58% of the investment is concentrated. Web conversions stand out, with 28% of the budget, and application promotion: the latter accounts for only 1.76% of the campaigns, but receives 11.% of the money. In recognition the opposite happens. TikTok dedicates 11% of its investment to reach, almost double the 6% that Meta dedicates to awareness.
The study thus draws a paradox of the current social advertising market: Meta maintains an enormous advantage in adoption and concentrates nine out of ten advertisers in the sample, while TikTok achieves lower costs in many of the objectives analyzed. The comparison, furthermore, does not point to a direct replacement of one platform for another, since their strengths change depending on the phase of the funnel and only a small part of advertisers currently work with both.